Help Topics
- Load SBML
- Load CSV
- Load Excel Spreadsheets
- Load from Model Collection
- Saving Files
- Clear Tables
- Exit
Visualization Menu
- Visualize Compartment
- Show Visualization Report
- Locate Identifier Columns
- Set Edge Flux Levels
- Reset Edge Flux Levels to Default
- Visualization Frame Menus
Visualization Menu
The MOST Visualization Menu is used to visualize models, locate identifier columns for visualization, and set levels for edge thicknesses in visualizations.
MOST uses KEGG IDs, ChEBI IDs, or Model SEED IDs to identify metabolites. Identifier columns are automatically located if the columns names contain "KEGG", "Kegg", "ChEBI", "CHEBI", or "Chebi", or "EC", "E.C.". EC Numbers or KEGG reaction IDs can be used to assist in identifying reactions but are not required.
Model SEED IDs in models from Model SEED are located in the Metabolite Abberviation column and automatically located when visualizing. Click here for more information on visualization.
MOST visualizes models by compartment. If any compartment entries are blank, the compartments will need to be renamed to a default name.
Models in the Model Collection that contain KEGG IDs and/or ChEBI IDs and can be visualized are indicated by a "Yes" entry in the Identifiers column. SBML models from Model SEED will also visualize if Model SEED IDs such as "cpd00001_c0" are located in the Metabolite Abbreviation column of the Metabolites table.
Select Visualization –> Visualize Compartment (Alt+V then Alt+V).
If MOST can locate identifiers in the metabolites table and there are no blank compartments, the Compartment Name Selection dialog will appear.
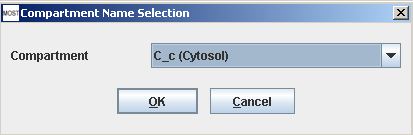
Select the compartment to visualize. Click the OK button to continue.
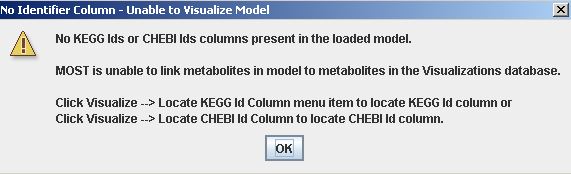
If no identifiers are found, the "No Identifier Column" warning will appear. See Locate Identifier Columns to locate an identifier column.
If any compartments are blank, the warning will appear.
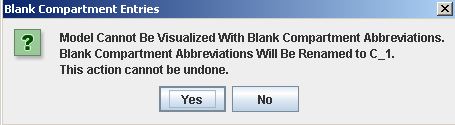
Blank compartments will be renamed to "C_1" or a default name if the "Yes" button is clicked before visualization. Clicking the "No" button will cancel the renaming of blank compartments and visualization of the model.
If an identifier column has been automatically located or user selected and there are no blank compartment entries, a progress bar will appear, followed by the Visualization frame. A Visualization report will appear on top of the Visualization frame if Show Visualization Report is selected in Visualization Options.
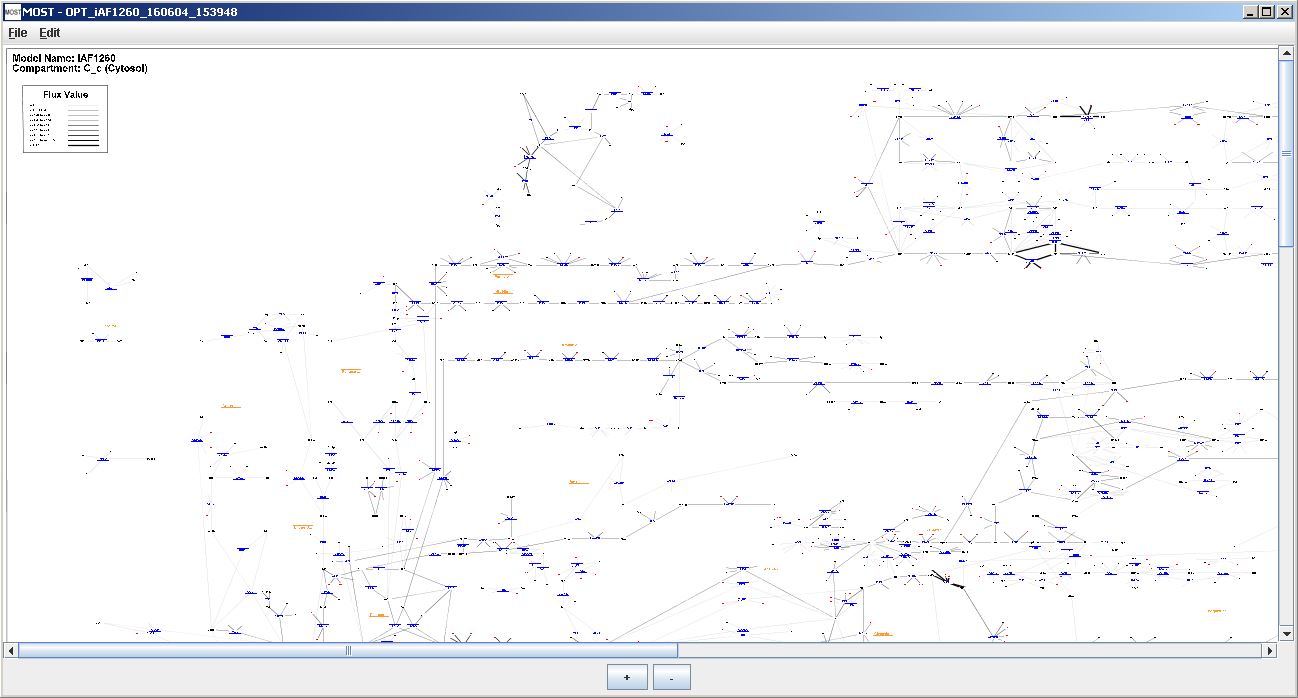
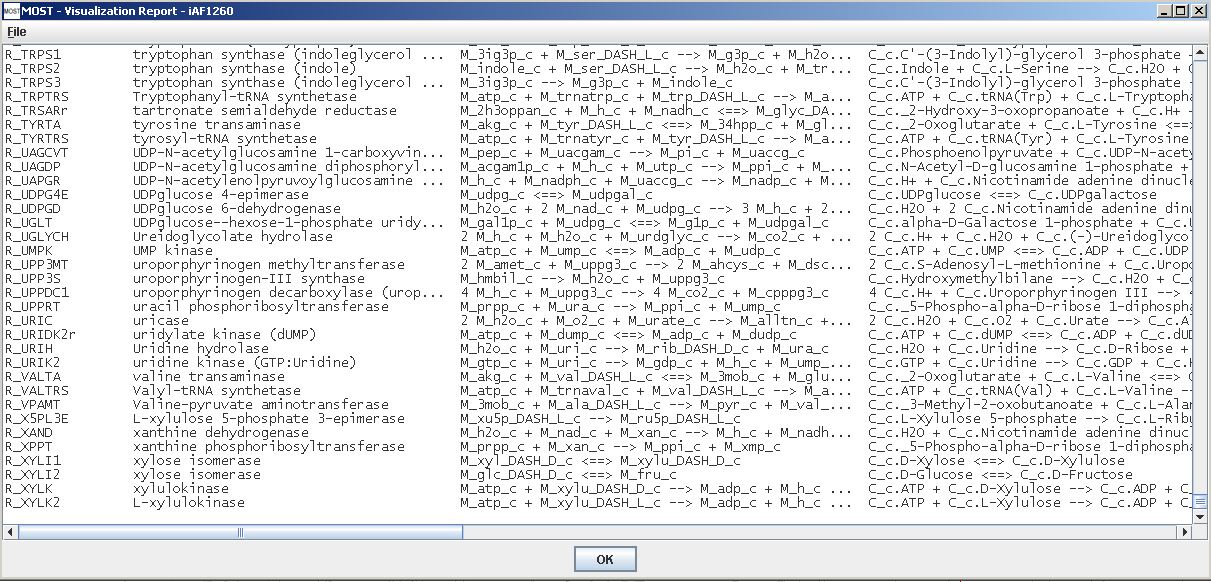
Visualization frame and Visualization report.
Select Visualization --> Show Visualization Report (Alt+V then Alt+Z) to show the report of reactions that were graphed and not graphed.
Identifier columns can be located manually if the loaded model contains identifiers, but the columns were not automatically located by MOST because the column names are not contained in the list of commonly used names.
The following menu items exist in the Visualize menu to locate identifier columns: "Locate KEGG Metabolite ID Column", "Locate ChEBI ID Column", "Locate EC Number Column", and "Locate KEGG Reaction ID Column".
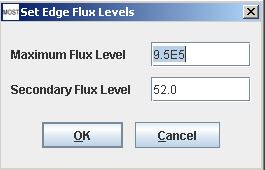
If "Scale Edge Thickness Using Flux Values" is selected in Visualization Options, the default settings for scaling edge thicknesses is to use the maximum upper bound in a model as the Maximum Flux Level. Any reaction with a flux within 95% of the level is considered infinite and is drawn using the maximum edge thickness. The maximum non-infinite flux in the model is used to set the Secondary Flux Level. These levels can be set by usnig the Set Edge Flux Levels menu item. Select Visualization –> Set Edge Flux Levels (Alt+V then Alt+F). The Set Edge Flux Levels dialog will appear. This option is useful when comparing fluxes in different visualizations. (Edge thicknesses are calculated using the absolute value of fluxes.)
Reset Edge Flux Levels to Default:
The default setting can be restored by clicking Visualization –> Reset Edge Flux Levels to Default (Alt+V then Alt+D).
File Menu
The Visualization File Menu is used for saving visualizations as SVG (Scalable Vector Graphics) files or PNG (Portable Network Graphics) files..
Select File –> Save Graph As SVG (Alt+F then Alt+S), select a directory to save to, then type in a name for the file. If the name does not end with ".svg", the name will be appended with the extension. The entire graph will be written as an SVG file. SVG files can be edited using vector graphics editing software such as the commercial program Adobe Illustrator. Free programs are also available for editing SVG files such as Inkscape.
Select File –> Save Window As PNG (Alt+F then Alt+W), select a directory to save to, then type in a name for the file. If the name does not end with ".png", the name will be appended with the extension. The portion of the graph visible in the window will be written as a PNG file.
Edit Menu
Select Edit –> Find (Alt+E then Alt+F, or Ctrl+F). The Visualization Find dialog will appear. When the Find button is clicked, nodes that contain the item entered will be scrolled to the center of the frame.
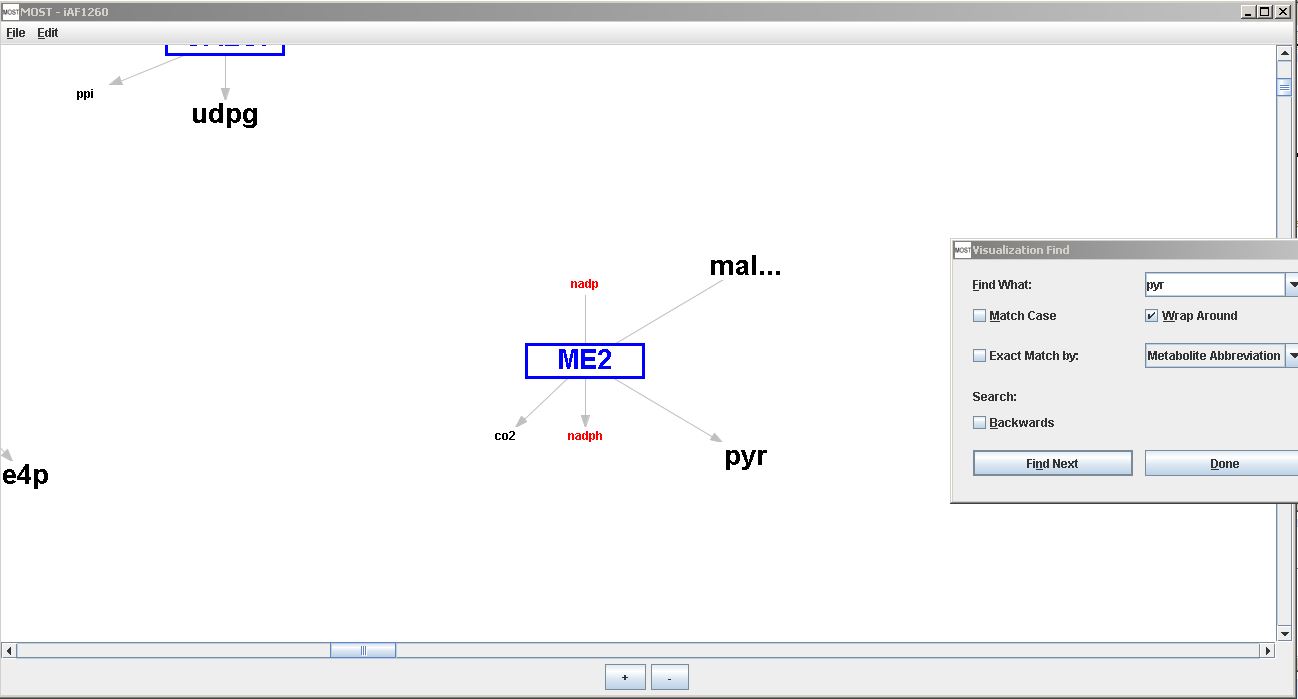
Example of Find - the reaction node "ME2" in the center of the frame contains "pyr" entered in the "Find What" text area of the Find Dialog. Reaction "ME2" is "M_mal_L_c + M_nadp_c --> M_co2_c + M_nadph_c + M_pyr_c" and contains "pyr"
Visualization Find has advanced find options such as find by Exact Match by Metabolite Abbreviation, KEGG Metabolite ID, EC Number, KEGG Reaction ID, and Reaction Abbreviation to refine your search.