Help Topics
- Load SBML
- Load CSV
- Load Excel Spreadsheets
- Load from Model Collection
- Saving Files
- Clear Tables
- Exit
- Visualize Compartment
- Show Visualization Report
- Locate Identifier Columns
- Set Edge Flux Levels
- Reset Edge Flux Levels to Default
- Visualization Frame Menus
E-Flux2 Tutorial
Step 1
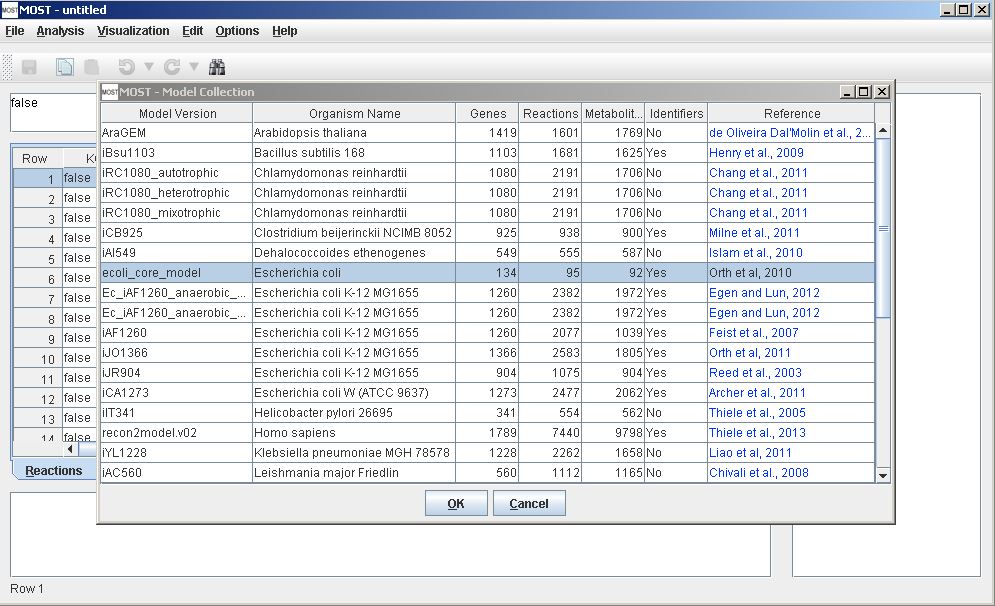
Load Model. To load an SBML or CSV model, go to File, then click either Load SBML or Load CSV. A model from the Model Collection Database can also be used. Select File → Load from Model Collection Database (Alt+F then Alt+D). If necessary, the model can be edited after being loaded depending on your experiment. For a test purpose, select ecoli_core_model, then click the OK button on the Model Collection dialog. This model will be used for this tutorial
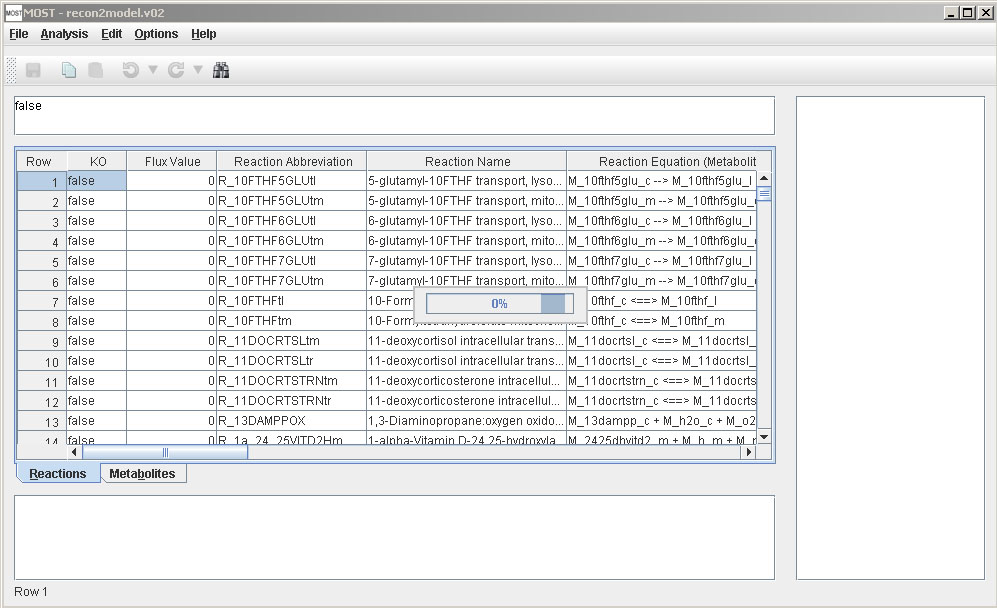
The progress bar will appear while the model is loading, then close when the load is finished.
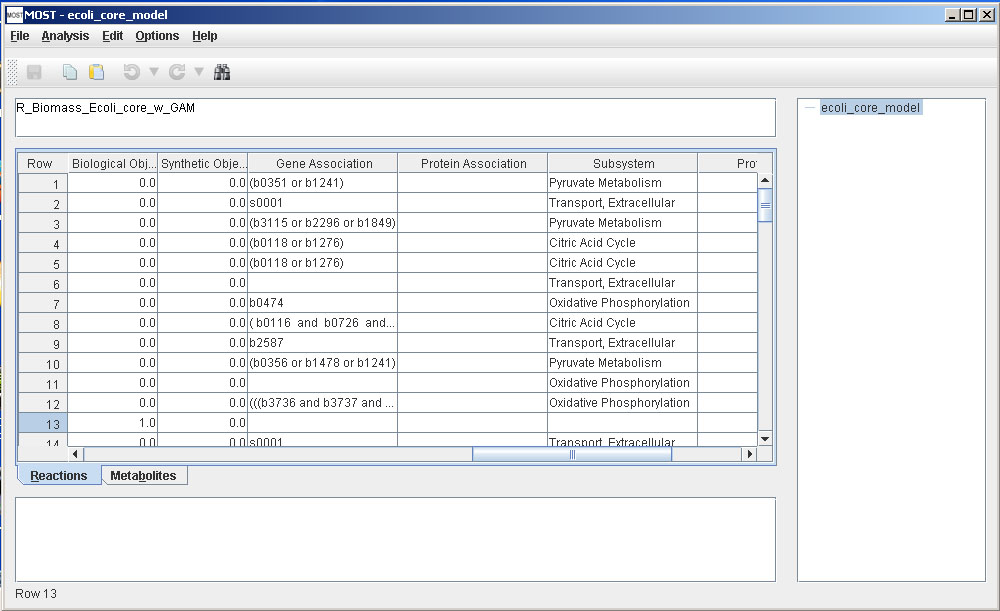
Set Biological Objective. Usually the biomass reaction is chosen as the Biological Objective to be maximized. An easy way to find the biomass reaction in most models is to use the Find/Replace dialog using Control-F keystroke on the keyboard. Type in biomass, and click the Find button.
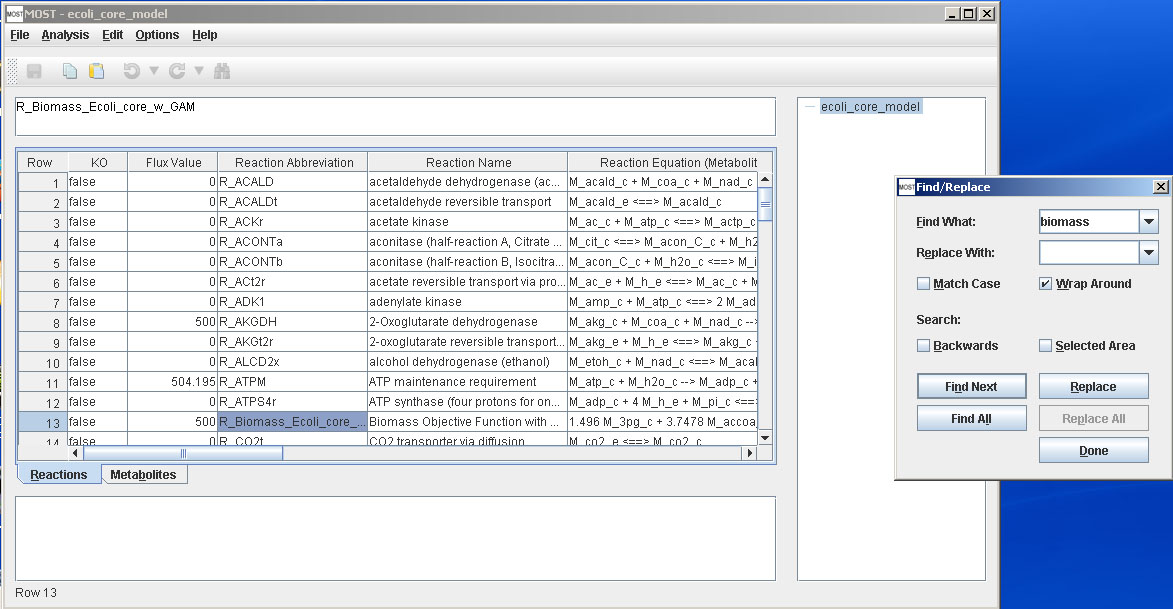
Once this reaction is located, scroll right to the Biological Objective column. All models in the Model Collection table already have the biomass reaction objective set to 1.0, so this will not need to be changed. If a model from a different source is used, the Biological Objective may need to be set.
Step 3
Load Gene Expression File.
E-Flux2 requires a CSV file with two columns where the first column in the gene name and the second column is the gene expression as shown below:
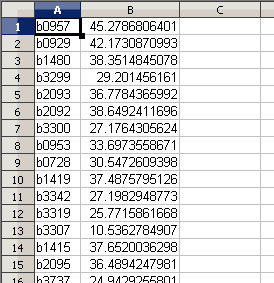
Click here to download a sample gene expression csv file that can be used for the test of the ecoli_core_model.
Step 4
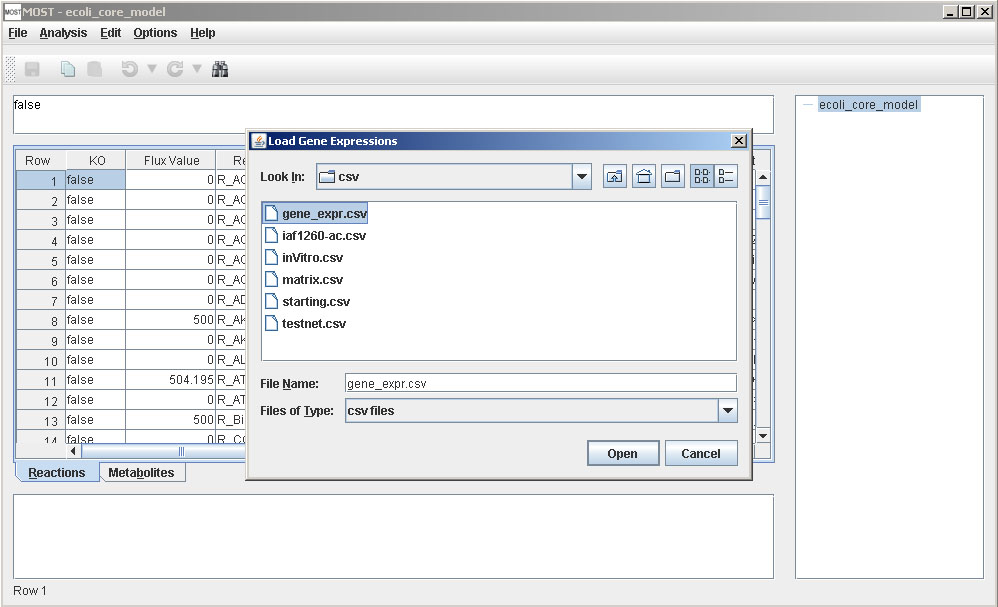
Run Analysis. Select Analysis → E-Flux2 (Alt+A then Alt+E)..
A file browser will appear. Select the gene expression csv downloaded in Step 3, then click the Open button on the file browser.
A progress bar will appear:
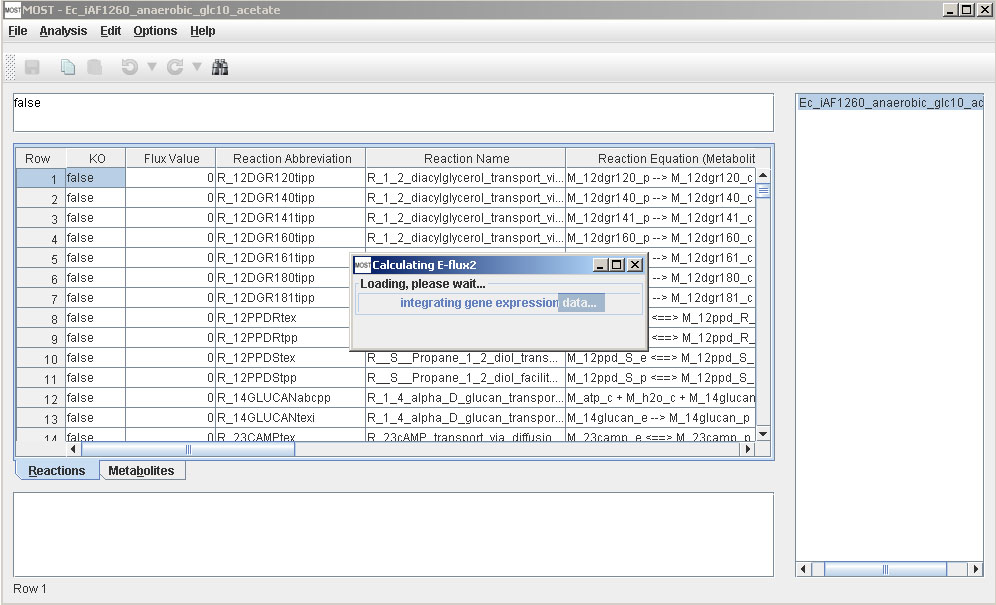
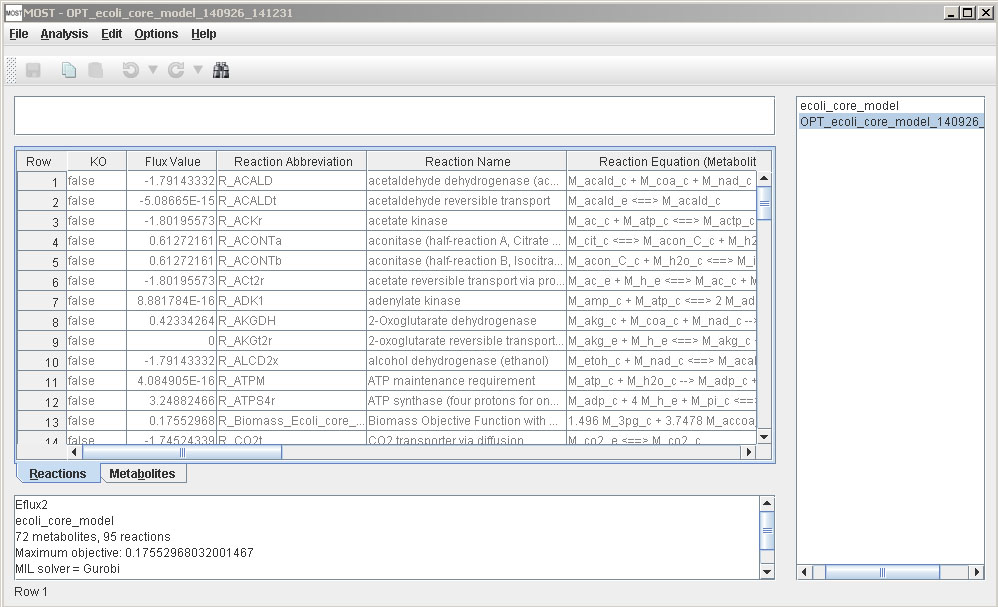
After E-Flux2 is finished, a new link of the optimization result will be added to the tree on the upper right panel, and results will be displayed in the console. The numerical values in the Flux Value column shows the predicted metabolic fluxes.