Help Topics
- Load SBML
- Load CSV
- Load Excel Spreadsheets
- Load from Model Collection
- Saving Files
- Clear Tables
- Exit
- Visualize Compartment
- Show Visualization Report
- Locate Identifier Columns
- Set Edge Flux Levels
- Reset Edge Flux Levels to Default
- Visualization Frame Menus
Visualization Tutorial
Step 1
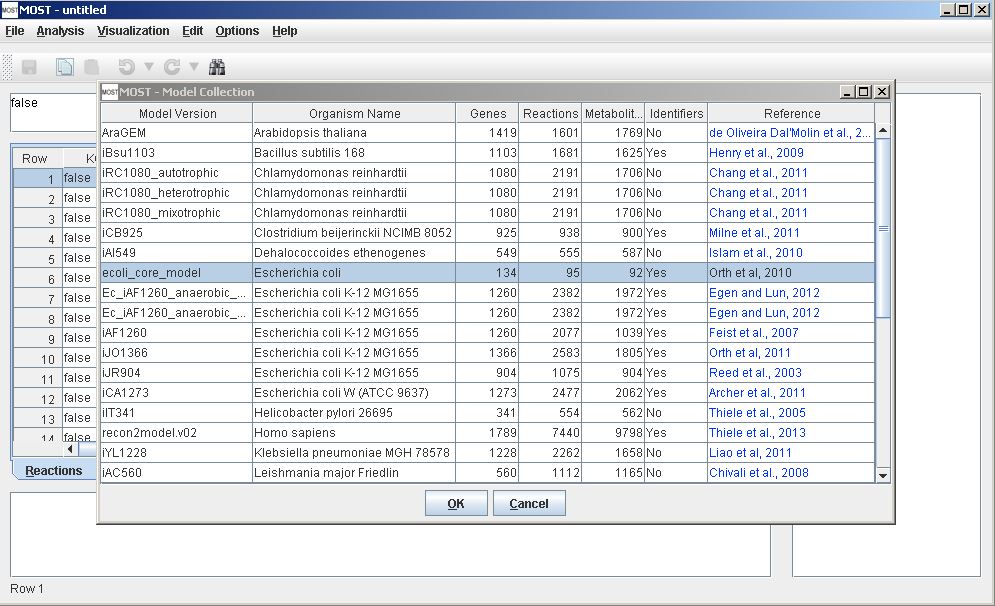
Load Model. Select File –> Load from Model Collection Database (Alt+F then Alt+D). For a test purpose, select ecoli_core_model, then click the OK button on the Model Collection dialog. This model will be used for this tutorial since it is a small model and therefore visualization will be rapid on any computer. Notice the "Yes" entry in the Identifiers column, meaning the model has KEGG IDs or ChEBI IDs or both. Only models with identifiers can be visualized. See the Visualization Menu page for more on identifiers.
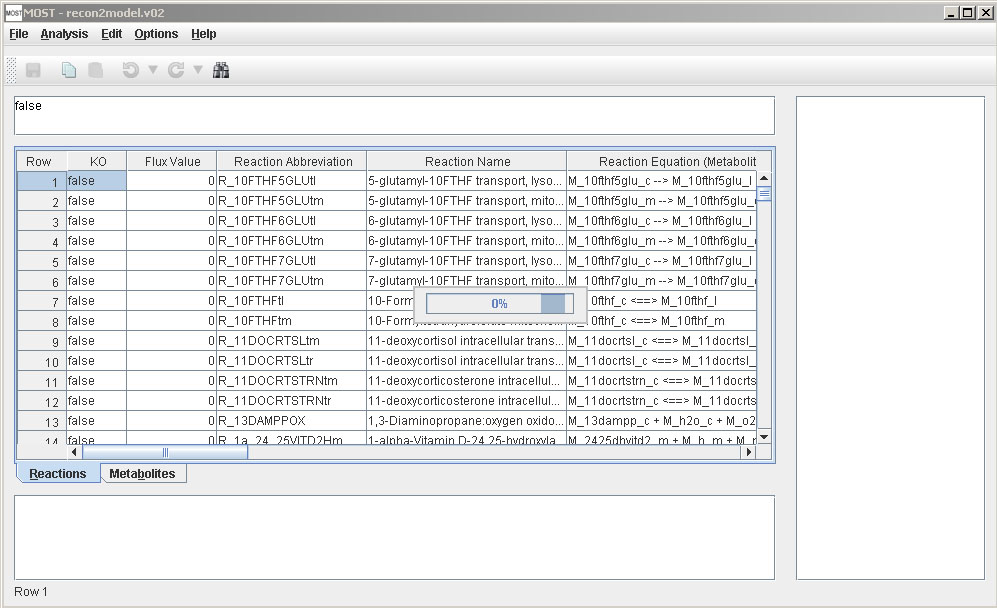
The progress bar will appear while the model is loading, then close when the load is finished.
Step 2
Visualize Compartment. Select Visualization → Visualize Compartment (Alt+V then Alt+V).
The Compartment Name Selection dialog will appear.
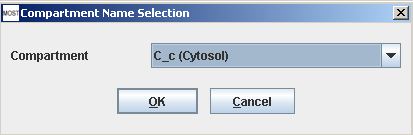
Select "C_c (Cytosol)" to visualize the cytosol compartment. This compartment should already be selected, but if not click the arrow next to the dropbox to select this compartment. Click the OK button to continue.
The progress bar will appear while the model is being processed, then close when the visualization is finished.
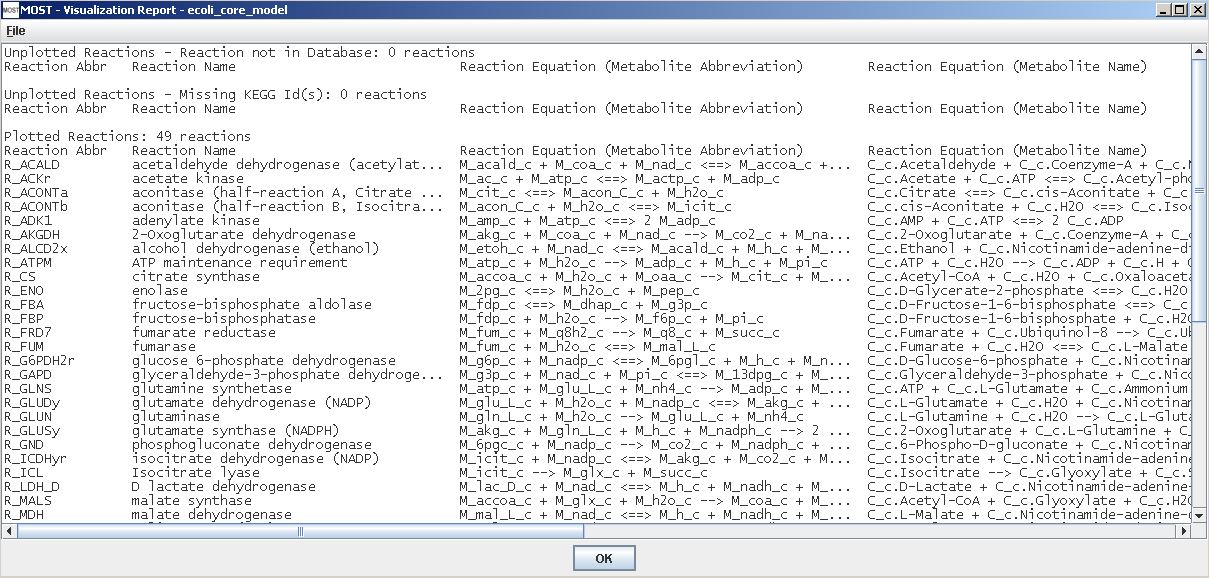
A Visualization report will appear on top of the Visualization frame. The report lists reactions that were graphed and not graphed. For the ecoli_core_model, all 49 of the reactions in the cytosol compartment will be visualized and listed in the Plotted Reactions category. The OK button on the bottom of the report or X button on the top right can be used to close the report, or the report can be minimized to view the Visualization frame. If the report was closed it can easily be viewed again by selecting Options –> Visualization Options -> Show Visualization Report from the Graphical Interface menu bar.(Alt+O then Alt+V then Alt+R).
Visualization Report
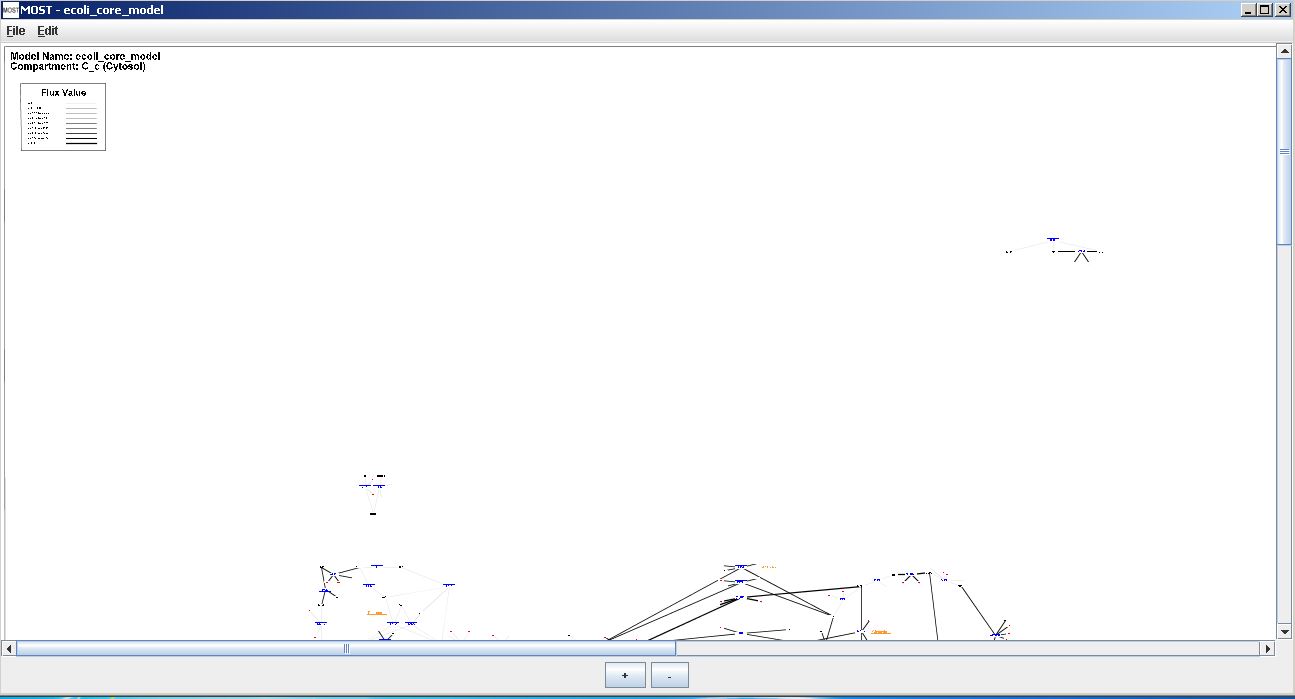
Visualization Frame
Step 3
Navigate the Visualization
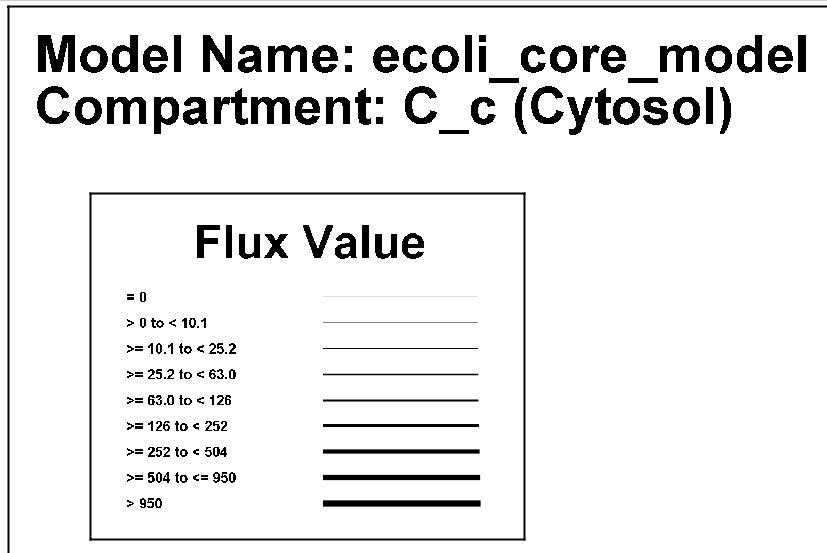
MOST-Visualization features zoom and pan navigation. The visualization can be panned by dragging the mouse inside the drawing or moving the scroll bars. The "+" button will zoom in and the "-" button will zoom out. The name of the model and compartment visualized are in the top left corner. A legend containing line thicknesses and the flux ranges (absolute value) that each thickness represents lies below the compartment name if the model contains any non-zero fluxes.
The remainder of the visualization contains reaction, and metabolite nodes joined by edges and pathway labels. See Visualization Overview.
Step 4
Save the Visualization as an SVG file
Using the menu bar on the Visualization Frame, select File –> Save Graph As SVG (Alt+F then Alt+S), select a directory to save to, then type in a name for the file. If the name does not end with ".svg", the name will be appended with the extension. The entire graph will be written as an SVG (Scalable Vector Graphics) file. SVG files can be edited using vector graphics editing software such as the commercial program Adobe Illustrator. Free programs are also available for editing SVG files such as Inkscape.
An SVG created from the visualization of this model can be found here.
Step 5
Visualize Larger Models
The visualization of the ecoli_core is rather sparse considering the small number of reactions present. After becoming accustomed to the appearance and navigation of the visualization of a small model, try loading a larger model such as iAF1260 or another model that has a "Yes" in the Identifiers column.
An analysis of the SVG files and reports follows for several models.
E. coli K-12 MG1655 iAF1260 model Cytosol compartment
Please use the links below to download the following files:
These files were created from visualization of the iAF1260 model. File 3 is the Visualization Report for file 1. The first category in the report is “Unplotted Reactions - Reaction not in Database”. These are reactions where all metabolites have been identified KEGG IDs but these reactions are not present in our map and therefore are not plotted. The second category is “Unplotted Reactions - Missing KEGG ID(s)”. Reactions in this category contain one or more metabolites that are not identified by a KEGG ID or other identifier (see S2 below for a description of identifiers). The third category is “Plotted Reactions”. These reactions are plotted in the visualization.
File 5 is a visualization of the iAF1260 model where the option “Graph All Reactions and Metabolites in Database” has been selected in the Options -> Visualization Options menu. If this option is selected and a model is visualized, reactions nodes and the nodes of metabolites that exclusively participate in that reaction that are not identified are shown in light colors. The tooltips of unidentified reaction nodes will show which metabolites need to be present for the reaction to be plotted. The tooltips of unidentified metabolite nodes will contain information from the database only (3 lines as opposed to 6 for identified metabolites). The “Unplotted Reactions” category in the report and the “Graph All Reactions and Metabolites in Database” option can assist a user to identify metabolites that are not identified in a model.
In file 1 there is no legend in the upper left since all fluxes are 0 in the iAF1260 model. The edges of all reactions will be thin gray lines. If FBA is run on this model, the model will contain non-zero fluxes and a legend will be present showing edge thicknesses for fluxes. See file 3 and the report for this visualization – file 4.
In File 5, the Calvin Cycle is plotted since all reactions and metabolites in the database have been plotted. In files 1 and 3 the Calvin Cycle is not plotted since reactions that only occur in the Calvin Cycle have not been found in the model.
File 6 and file 7, the report for this file show the results if the option “Graph All Reactions and Metabolites in Database” has been deselected and “Always Graph Calvin Cycle” has been selected in the Options -> Visualization Options menu and then a model is visualized. Any reactions found in the model that occur in the Calvin Cycle will be plotted. This option is useful if the user believes the Calvin Cycle should be present in the visualized model.
Synechococcus sp. PCC 7002 syn7002 model Cytosol compartment – an example of a model with a Calvin Cycle
Please use the links below to download the following files:
The option “Graph All Reactions and Metabolites in Database” has been deselected and “Always Graph Calvin Cycle” has been deselected in the Options -> Visualization Options menu, then this model was visualized. Files 1 and 2 were created from this visualization. Notice that the Calvin Cycle is found since reactions that only occur in this model are found. The Calvin Cycle can be found near the top of the visualization to the right of the model name and compartment label.
Reports for this model and others can be analyzed similarly to the analysis of the report in the iAF1260 section above. Supplementary Table S2 shows the number of reactions in each category for 35 models.
Additional SVG files and reports have been created from the Homo sapiens recon2model.v02 and the Saccharomyces cerevisiae Yeast v6.0 yeast_7.6 models. Please use the links below to download the following files:
Homo sapiens recon2model.v02 Cytoplasm compartment:
Homo sapiens recon2model.v02 Mitochondrion compartment:
Saccharomyces cerevisiae Yeast v6.0 yeast_7.6 model Cytoplasm compartment
Saccharomyces cerevisiae Yeast v6.0 yeast_7.6 model Mitochondrion compartment